import numpy as np
import matplotlib.pyplot as pltHints for homework 2
Question 1 & 2
There are multiple ways to add a column of ones to a matrix in numpy. \[\mathbf{X} = \begin{bmatrix} X_{11} & X_{12} & \dots & X_{1d} \\ X_{21} & X_{22} & \dots & X_{2d} \\ \vdots & \vdots & \ddots & \vdots \\ X_{N1} & X_{N2} & \dots & X_{Nd} \\ \end{bmatrix} \longrightarrow \begin{bmatrix} X_{11} & X_{12} & \dots & X_{1d} & 1 \\ X_{21} & X_{22} & \dots & X_{2d} & 1 \\ \vdots & \vdots & \ddots & \vdots & \vdots \\ X_{N1} & X_{N2} & \dots & X_{Nd} & 1 \\ \end{bmatrix}\]
## Example 4x4 matrix
X = np.zeros((4,4))
X
array([[0., 0., 0., 0.],
[0., 0., 0., 0.],
[0., 0., 0., 0.],
[0., 0., 0., 0.]])## Using np.concatenate
ones = np.ones((X.shape[0], 1))
Xaug = np.concatenate([X, ones], axis=1)
Xaugarray([[0., 0., 0., 0., 1.],
[0., 0., 0., 0., 1.],
[0., 0., 0., 0., 1.],
[0., 0., 0., 0., 1.]])## Using np.pad
Xaug = np.pad(X, [(0,0), (0,1)], constant_values=1.)
Xaugarray([[0., 0., 0., 0., 1.],
[0., 0., 0., 0., 1.],
[0., 0., 0., 0., 1.],
[0., 0., 0., 0., 1.]])We could also use pad to add a 1 to a one-dimensional vector:
## Example vector
x = np.zeros((4,))
xaug = np.pad(x, [(0,1)], constant_values=1.)
print(x)
print(xaug)
[0. 0. 0. 0.]
[0. 0. 0. 0. 1.]Question 2
In order to plot a function with MatPlotLib, we need to provide the np.plot function with a set of inputs and outputs. For example, let’s say we want to plot the function \[f(x) = \sin(x)\] for inputs between \(0\) and \(10\) (we say we want to plot \(\sin(x)\) on the range \([0,10]\)). We first need a set of inputs between \(0\) and \(10\). The np.linspace(a, b, n) function will give us n equally-spaced values between a and b. We can use this to define the inputs to our function.
x = np.linspace(0, 10, 100)Then, we can compute the corresponding set of outputs:
y = np.sin(x)Finally we can plot these values to np.plot, which will “connect-the-dots” to make a smooth plot.
plt.plot(x, y)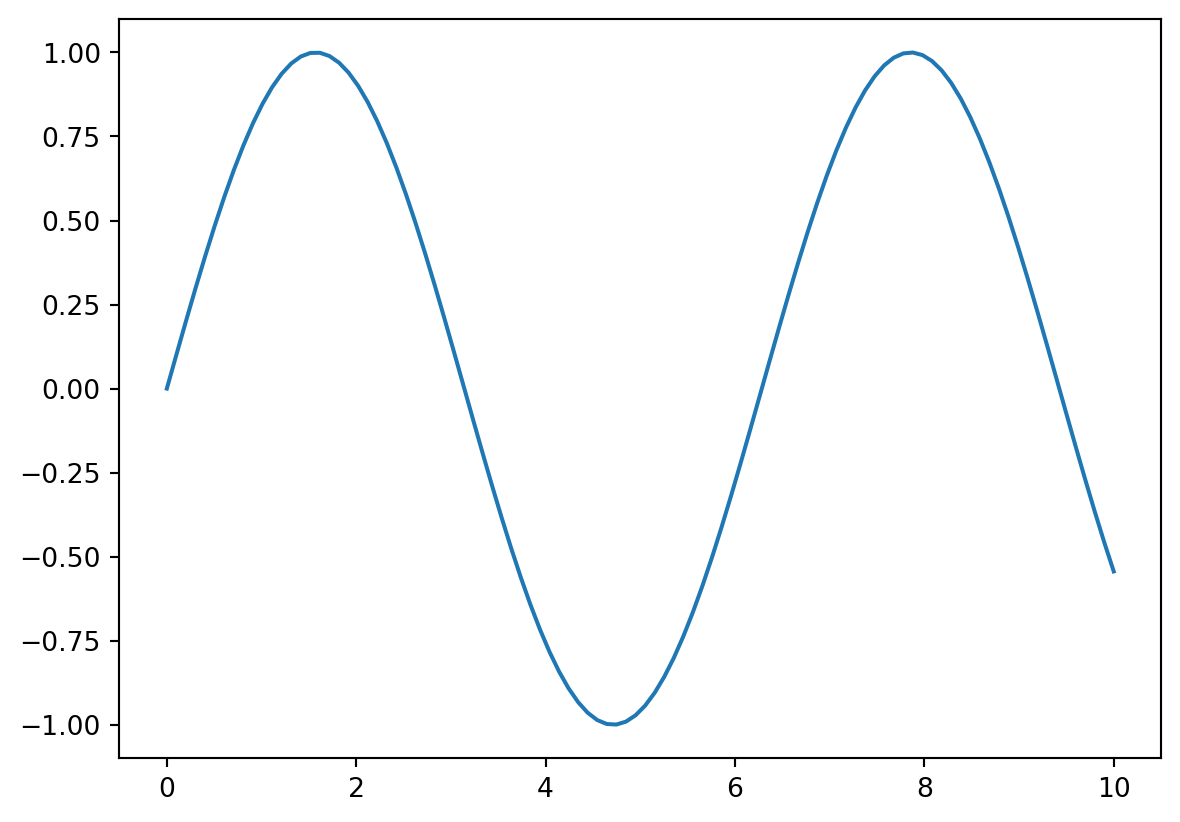
We can see more clearly what np.plot is doing if we lower the number of inputs that we use to plot our function and add markers at each point:
x = np.linspace(0, 10, 10)
y = np.sin(x)
plt.plot(x, y, marker='o')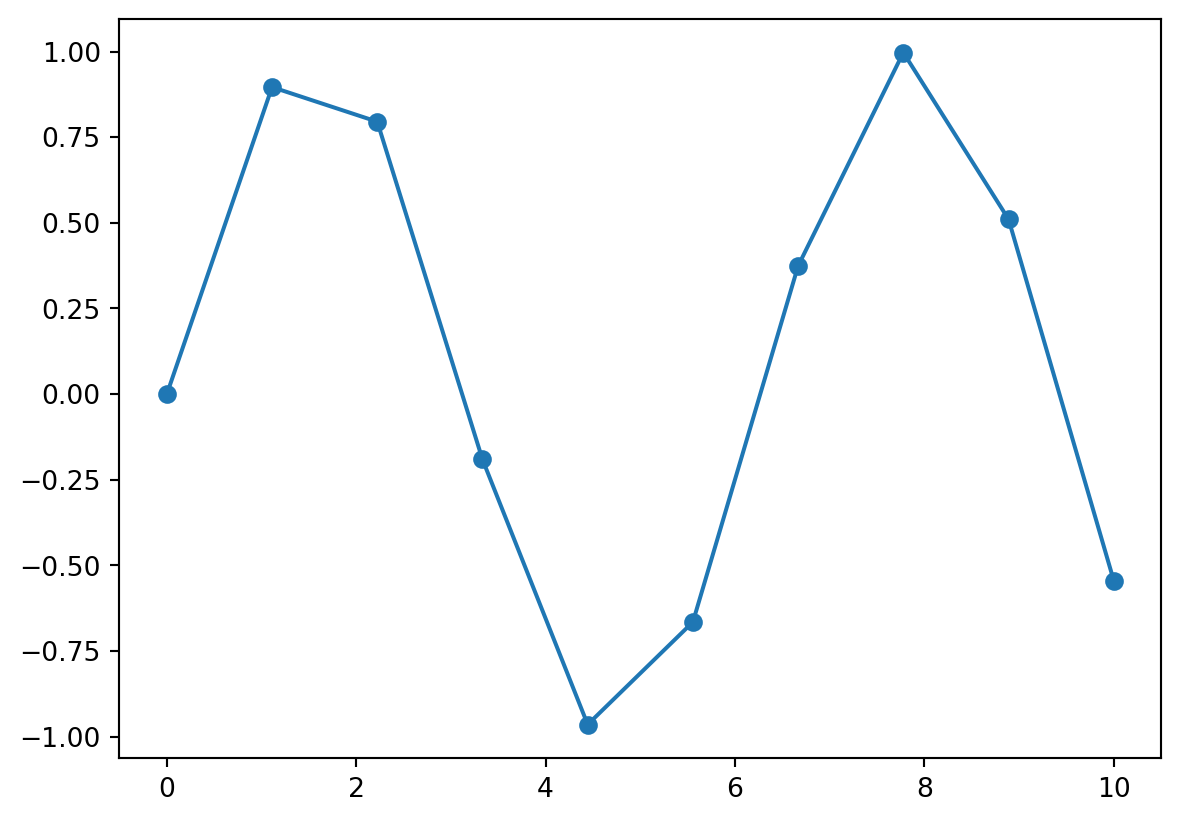
The prediction function for linear regression takes in vectors and outputs scalars: \[f(\mathbf{x})=\mathbf{x}^T\mathbf{w}\] We saw that we can rewrite the prediction function to make predictions for an entire set of inputs: \[f(\mathbf{X})=\mathbf{X}\mathbf{w}\] Where \[ \mathbf{X} = \begin{bmatrix} X_{11} & X_{12} & \dots & X_{1d} & 1 \\ X_{21} & X_{22} & \dots & X_{2d} & 1 \\ \vdots & \vdots & \ddots & \vdots & \vdots \\ X_{N1} & X_{N2} & \dots & X_{Nd} & 1 \\ \end{bmatrix} = \begin{bmatrix} \mathbf{x}_1^T \\ \mathbf{x}_2^T \\ \vdots \\ \mathbf{x}_N^T \end{bmatrix}\] If our data only has a single feature (as in the Q2 ), then this becomes: \[ f(\mathbf{X}) =\mathbf{X}\mathbf{w}= \begin{bmatrix} X_{11} & 1 \\ X_{21} & 1 \\ \vdots & \vdots \\ X_{N1} & 1 \\ \end{bmatrix} \cdot \begin{bmatrix} w_{1} \\ b \end{bmatrix} \]
In numpy, consider converting a range of inputs into a data matrix like the one above:
x = np.linspace(0, 5, 6) # Get range of inputs
X = x[:, None]             # Convert vector into an Nx1 matrix
# Add a column of 1s
Xaug = np.pad(X, [(0,0), (0,1)], constant_values=1.)
print(Xaug)
[[0. 1.]
[1. 1.]
[2. 1.]
[3. 1.]
[4. 1.]
[5. 1.]]This gives us something we can pass into our prediction function.
Question 8
If we want to split a matrix by its rows in numpy as follow:
\[ \mathbf{X} = \begin{bmatrix} X_{11} & X_{12} \\ X_{21} & X_{22} \\ X_{31} & X_{32} \\ X_{41} & X_{42} \\ X_{51} & X_{52} \\ \end{bmatrix}\longrightarrow \begin{bmatrix} X_{11} & X_{12} \\ X_{21} & X_{22} \\ X_{31} & X_{32} \\ \end{bmatrix}, \quad \begin{bmatrix} X_{41} & X_{42} \\ X_{51} & X_{52} \\ \end{bmatrix}\]
We can use the index operator [] as follows:
X = np.random.randint(10, size=(5,2))
print(X)
[[8 8]
[1 9]
[1 9]
[2 7]
[7 6]]print(X[:3]) # Get first 3 rows[[8 8]
[1 9]
[1 9]]print(X[3:]) # Get the rest of the rows[[2 7]
[7 6]]